New data released this week by two federal agencies put the significant greenhouse gas (GHG) emission reductions attributable to the growing switch to natural gas-fired electricity generation in the spotlight.
The latest U.S. Energy Information Administration (EIA) data show that 63 percent of the 89 million metric tons (MMmt) of energy-related carbon emissions reduction in 2016 can be credited to fuel switches to natural gas for electricity generation. The U.S. Environmental Protection Agency (EPA) also released its annual Greenhouse Gas Reporting Program (GHGRP) data, which largely credited America’s largest industrial facilities’ two percent GHG emissions reductions in 2016 to a 4.8 percent reduction in emissions from power plants – also greatly attributed to the switch to natural gas-fired power generation.
EIA data shows significant emissions reductions for natural gas over renewables
Data from the EIA shows that the switch to natural gas-fired electricity generation continues to drive down overall U.S. energy-related GHG emissions. From 2005 to 2016, U.S. electricity generation grew by one percent while power plant CO2 emissions plummeted 24 percent, or 3,176 MMmt. According to EIA,
“Of this total, 2,007 MMmt can be attributed to the shift in fossil fuels to natural gas, and 1,169 MMmt can be attributed to the increase in non-fossil generation sources.” (emphasis added)
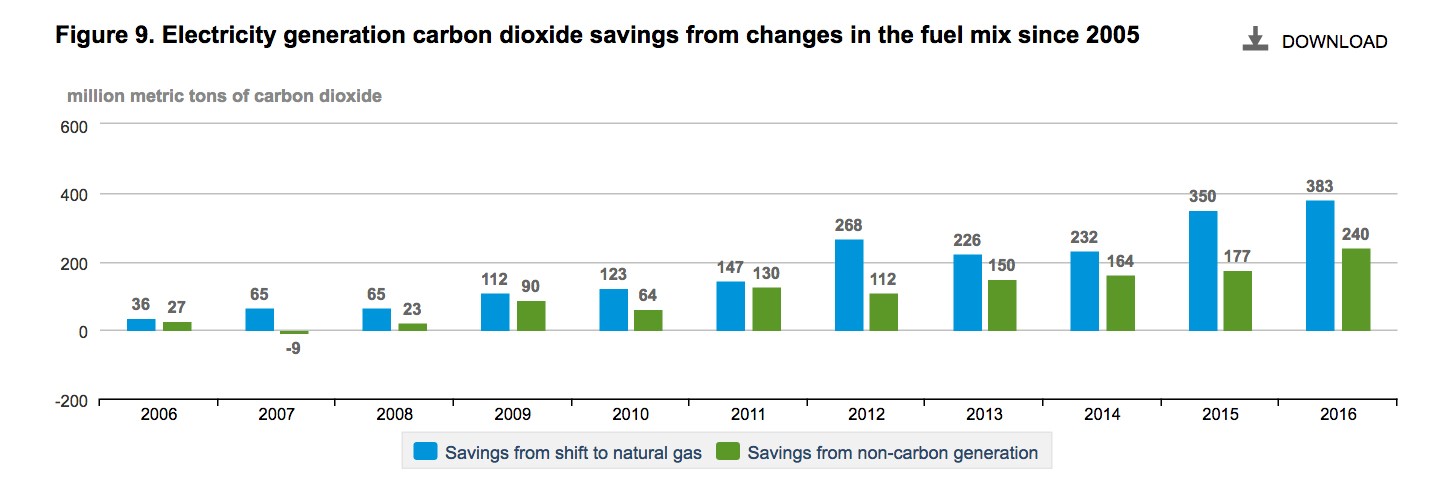
During the 2005 to 2016 time frame, natural gas electricity generation increased from 19 percent to 34 percent of total U.S. electricity generation (79 percent increase) and was responsible for 63 percent of total power plant carbon emission reductions. That’s 72 percent more carbon savings from natural gas than nuclear and renewable sources combined!
Total energy-related carbon emissions have declined in six of the last 10 years — including a 1.7 percent decrease in 2016, dropping emissions 14 percent (823 MMmt) below 2005 levels. Notably, the U.S. gross domestic product (GDP) has grown 13 percent since 2006. From the EIA:
“Energy-related carbon dioxide (CO2) emissions decreased by 89 million metric tons (MMmt), from 5,259 MMmt in 2015 to 5,170 MMmt in 2016. Although real gross domestic product (GDP) increased 1.5% over that period, other factors contributing to energy-related CO2 emissions more than offset the growth in GDP, leading to a 1.7% decline in energy-related CO2.” (emphasis added)
This unprecedented trend of sustained carbon emission reductions being coupled with economic growth is illustrated in the following EID chart. Not coincidently this historic trend has coincided with natural gas consumption skyrocketing as result of the shale revolution.

EPA data also shows significant emissions reductions from power plants
Similarly, EPA’s latest Greenhouse Gas Reporting Program data finds that U.S. GHG emissions from large facilities — facilities that emit more than 25,000 tons of CO2 per year — fell by 2 percent in 2016 and 10 percent below 2006 levels.. That decline was spearheaded by the power sector, which reduced GHG emissions by 4.6 percent in 2016, and has seen a total reduction of 18 percent since 2011, when the EPA first began tracking this data.
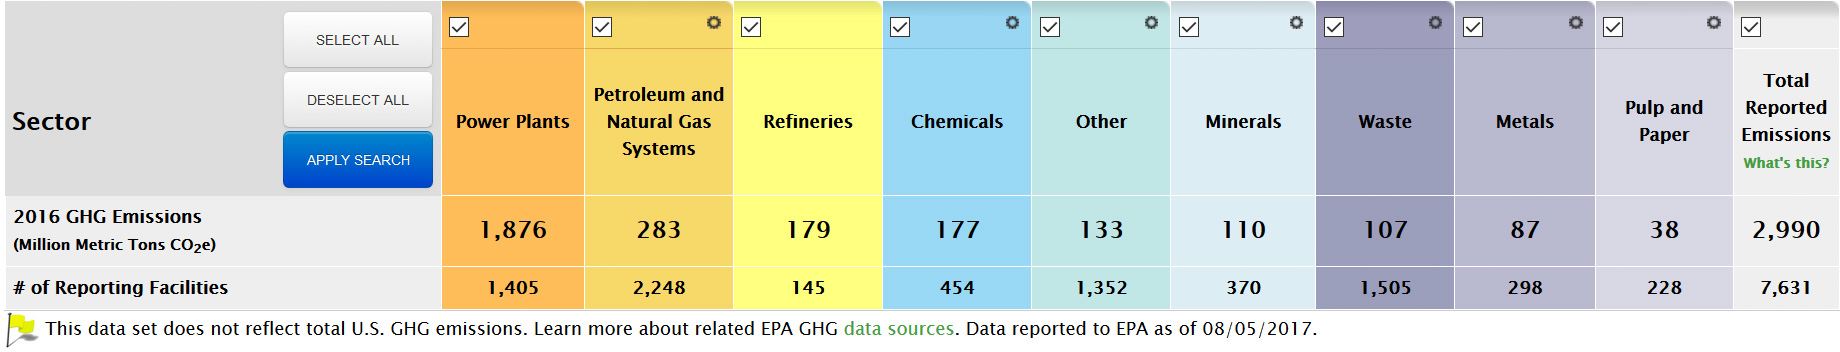

Though the EPA data show overall GHG emissions for the oil and gas sector rose to 283 million tons in 2016 from 233 million in 2015 – an increase that can be traced to the fact that this was the first year Gathering and Boosting and Transmission Pipeline industry segments began reporting to the GHGRP – some of the biggest oil and gas producing shale basins have seen decreased methane emissions from natural gas systems.
For instance, the Appalachian Basin, which includes the Marcellus and Utica shales, saw methane emissions fall 3.5 percent in 2016. From 2011 to 2016, the Appalachian Basin has reduced methane emissions by a whopping 63 percent, while at the same time being the “main driver of growth in total U.S. shale gas production and the main source of total U.S. dry natural gas production,” according to EIA.
Here’s a look at methane emission reductions detailed in the latest GHGRP data for some of America’s top producing oil and natural gas shale basins, including the Bakken, Barnett, Eagle Ford, Haynesville, Marcellus and Utica shale plays:

The Anadarko Basin includes Texas and Oklahoma’s SCOOP and STACK plays, and was recently added to the EIA’s drilling productivity reports because of the production growth taking place in the region. While this increased production has occurred, the basin reduced methane emissions by 3.1 MMmt or 34 percent from 2011 to 2016.
Further, the San Juan Basin which can be found in parts of Arizona, Colorado, New Mexico and Utah, and particularly the Four Corners region where all of the states meet, has been the focus of scrutiny in recent years due to increased methane emissions that were blamed on oil and gas operations. According to the EPA’s data, the San Juan Basin saw emissions decrease two percent (4.7 MMmt to 4.6 MMmt) from 2015 to 2016. And even more impressive, the oil and gas sector reduced its methane emissions in the San Juan Basin by 47 percent from 2011 to 2016, dropping from 8.6 MMmt to 4.6 MMmt.
EIA and EPA’s findings echo global emissions inventories released this year that similarly have found the United States is leading the way in carbon emissions reductions thanks to the increased use of natural gas made possible by shale development.