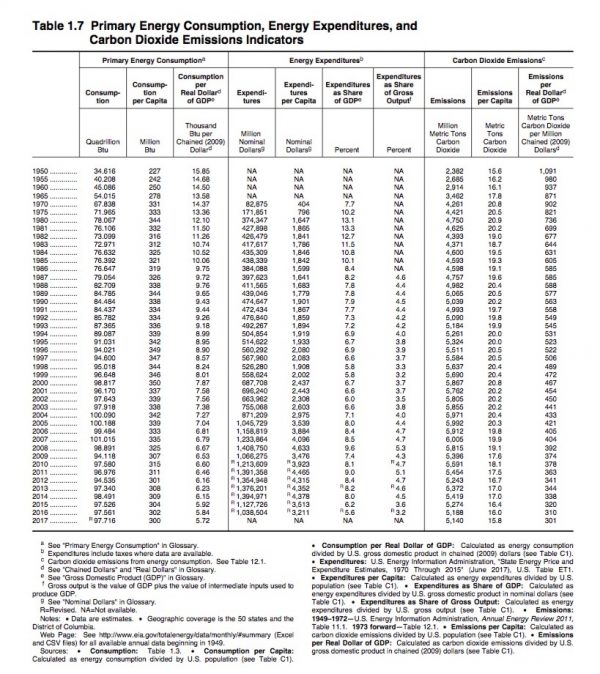
New Energy Information Administration (EIA) data released this week show that U.S. per capita carbon dioxide (CO2) emissions are at their lowest levels since 1950. As the “Emissions per Capita” column from the following EIA chart shows, 2017 U.S. per capita CO2 emissions were 15.8 metric tons per person, their lowest levels in 67 years.
For some perspective, per capita carbon emissions haven’t been this low since the beginning of the Korean War and the publication of the very first Peanuts comic strip (Good grief, Charlie Brown!).
The EIA and several other reputable third-party sources have been very clear as to why these trends are occurring in the United States — it’s because of the increased use of natural gas, which has been made abundant and affordable by advances in horizontal drilling and hydraulic fracturing technology.
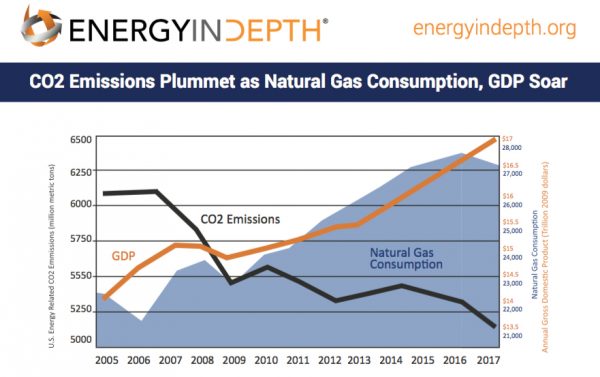
Overall U.S. carbon emissions are at their lowest levels since 1992 and have declined 13 percent since 2005. The EIA has credited two-thirds of the energy-related carbon reductions achieved since 2005 to natural gas, which has prevented over two billion metric tons of carbon dioxide from being emitted during that time.
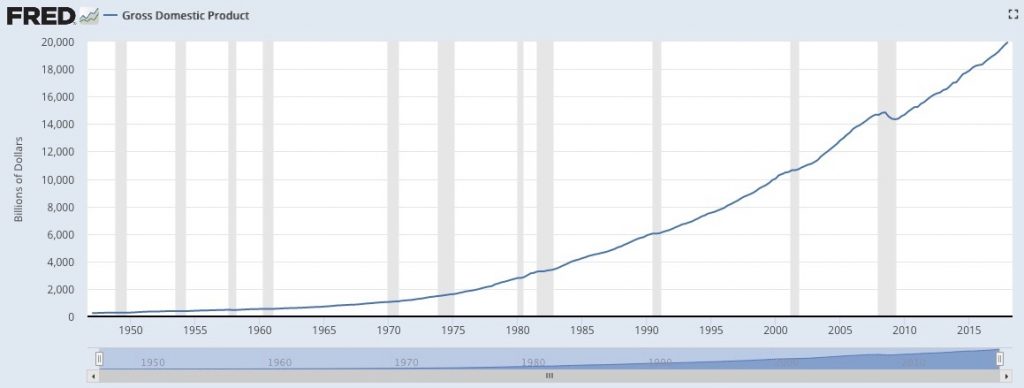
Perhaps even more remarkable than the fact that per capita carbon emissions are down nearly 21 percent since 2007 is the fact per capita gross domestic product (GDP) has increased more than 4.5 percent during that time, while real GDP has increased 38 percent over the past 10 years. U.S. GDP has also increased dramatically since 1950, as the following Federal Reserve Bank of St. Louis chart illustrates.
Remarkably, per capita CO2 emissions are roughly the same as they were when gasoline was 18 cents a gallon and the average salary was just north of $3,000 per year.
The coupling of economic growth along with greenhouse gas reductions the United States is currently enjoying is unprecedented in history. And the fact that it’s coincided with the ongoing shale revolution is no accident.
With dry natural gas production currently at a record 80 billion cubic feet per day (Bcf/d), natural gas is more affordable and available than at any other point in U.S. history. This has led to natural gas-fired electricity generation increasing 81 percent since 2005, going from just 19 percent in the electricity generation mix in 2005 to 34 percent last year, making it the top fuel source for electricity generation.
Because natural gas emits far less CO2 than other traditional fuels, power plant carbon emissions dropped to their lowest levels since 1985 in 2017.
The International Energy Agency (IEA) summed up what has happened in the United States perfectly when it stated in 2017 that:
“The US power sector has led the world in cutting CO2 emissions since 2008, thanks largely to natural gas… Emissions in the United States last year were at their lowest levels since 1992, a period during which the economy grew by 80%.”
The U.S. has also managed to make history by improving its energy efficiency via increased natural gas use. A recent study conducted by researchers at Carnegie Mellon University (CMU) reveals that carbon intensity — which is total carbon emissions divided by total output — from the U.S. power sector is down 30 percent since 2001. The report also notes that “declining generation from coal, and increased generation from natural gas and wind are the primary drivers for the CO2 intensity decrease.”
The EIA has echoed that report’s findings, noting that, “Natural gas-fired units tend to be more energy efficient, requiring less energy content to produce a unit of electricity,” while also recently stating:
“The carbon intensity of the electric power sector has fallen more recently, generally because of the shift away from coal-fired electricity generation toward less-carbon-intensive natural gas and carbon-free renewable energy forms, such as wind and solar.”
Incredibly, the United States leads all major nations in carbon reductions this century, according to the latest BP data. In fact, the United States decreased carbon emissions 42 million tons from 2016 levels in 2017 — more than any other country — while renewable- and regulation-happy Europe collectively saw emissions increase 92 million tons, including year-over-year emission increases in Germany and France.
The new EIA data is just the latest confirmation that fracking has allowed the United States to lead the world in greenhouse gas reductions while sustaining economic growth, proving once again that growing the economy and addressing environmental concerns is not an either-or proposition.