A new study authored by researchers at the University of Michigan is making headlines this week for its claims that the U.S. oil and natural gas industry is underestimating the efficacy of flaring, which would increase the amount of emissions estimated to occur from the process. However, there are several limitations to keep in mind when examining the study, including its use of aerial sampling and FLIR imaging without ground air measurements to reach these conclusions.
#1: Study methodology has admitted limitations, including going against the National Academy of Sciences’ recommendations
First, the study had limited observations based on the data it was able to compile. To determine its hypothesis, researchers involved in the study conducted 12 flights from 2020 to 2021 across three large development regions, the Permian, Bakken and Eagle Ford, a relatively limited observation window and timetable.
The study was further limited by its use of aerial observation over direct ground measurement of flares, which can be impacted by other factors, such as wind. In fact, the study details the strains of this approach:
“While this approach allows for straightforward attribution to the flare, it results in limited data as sampling the flare plume parallel to the wind is challenging.” (emphasis added)
The authors went on to further discuss these limitations, admitting that a “different study strategy” would be more effective:
“Investigations into possible drivers of reduced DRE, such as wind speed (measured at the aircraft), flare volume and temperature (VIIRS), and estimated well age and gas/oil ratio (37) did not yield compelling explanatory relationships, suggesting that the combination of our airborne sampling and these supplemental datasets cannot explain most of the observed flareCH4 DRE variability. Improving attribution to flare design, operation, and environmental conditions would require a different study strategy, likely with more information on individual flare infrastructure and operation.” (emphasis added)
In addition to this, the study relies on “Forward Looking Infrared”, or FLIR images, to observe flares in a ground-based survey to determine that 3.2 percent of active flares were unlit. However, FLIR technology is known to have limitations and has repeatedly been used to advance the “Keep It In the Ground” movement’s agenda. Other factors can mimic emissions plumes particularly when images are taken from long distances, which is why it is so important that videos like this be quantified at the source, i.e. measurements taken on site, as the following Western Energy Alliance video explains:
Furthermore, the study goes against the National Academy of Science’s recommendations for improving national methane emissions inventories, which recommends a combination of top-down and bottom-up observations, and collaboration with industry and academia.
An NAS report details:
“Coordinated, contemporaneous top-down and bottom-up measurement campaigns, conducted in a variety of source regions for anthropogenic methane emissions, are crucial for identifying knowledge gaps and prioritizing emission inventory improvements. Careful evaluation of such data for use in national methane inventories is necessary to ensure representativeness of annual average assessments.”
While the researchers did conduct some bottom-up observations in addition to their aerial sampling, this was done without coordination from industry.
A Wall Street Journal article on the study explained:
“The researchers didn’t identify the companies whose facilities were tested, nor did they alert the firms that the tests were being conducted. All ground sampling was done from public roads.” (emphasis added)
Not consulting industry severely limited the data that was able to be collected and goes against NAS recommendations which state:
“[V]erifiability is the bedrock upon which inventories should be built if they are to be widely applicable to policy needs.”
#2: Repeated studies have shown oil and natural gas methane emissions are declining, with routine flaring reduction as a key industry target.
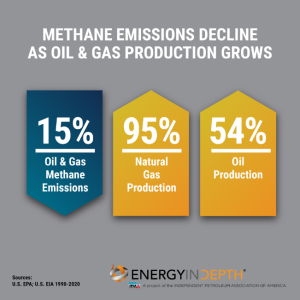
The EPA’s 2022 Greenhouse Gas Inventory shows that total U.S. greenhouse gas emissions are down 20 percent since 2005, including continued reductions of both CO2 and methane, thanks in large part to the switch toward natural gas for power generation.
Additionally, total CO2 equivalent (Mmt CO2Eq) of methane from petroleum and natural gas systems dropped by 15 percent despite rampant increases of oil and natural gas production.
This is a testament to the efforts of the U.S. oil and natural gas industry to decrease emissions from operations and infrastructure, buoyed by recent investments in technological advancements that help detect and limit methane emissions and a commitment to reduce routine flaring.
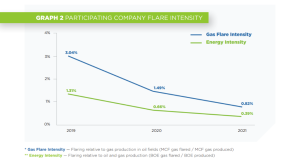
In fact, new data from the Environmental Partnership’s 2022 annual report explains how the U.S. oil and gas industry is making significant strides to reduce flaring, with participants cutting flare intensity nearly in half for the second year in a row:
“In 2021, there was a 40 percent increase in the number of participating companies in the flare management programs. These companies represent 62 percent and 40 percent of total U.S. oil and natural gas production, respectively. Including new company participants, there was a 45 percent reduction in flare intensity and a 26 percent reduction in total flare volumes from the previous year.”
Other partnerships exist that demonstrate the industry’s commitment to best practices when it comes to flaring as well. This year, the Oil and Gas Climate Initiative launched a tool-kit to help operators reduce emissions from flaring.
In addition, one of the regions the study examined to make its claim was the Bakken region, which includes North Dakota. However, studies have shown that North Dakota is making significant strides to reduce flaring. In 2021, as natural gas capture became a more prevalent practice, the amount of natural gas flared dropped to 7.5 percent of gas produced – a 60.5 percent reduction since 2019. In fact, operators exceeded state regulators’ goal to achieve a 91 percent capture rate by capturing around 92.5 percent of the natural gas across the state.
The North Dakota Industrial Commission’s (NDIC) data showed this number even lower in the Bakken region.
From the Journal of Petroleum Technology, which covered the study:
“The NDIC also showed that only 5.6 percent of gas was flared from wells in the liquids-rich Bakken formation. Most of the natural gas flared in North Dakota is considered associated gas that is produced from oil wells. The recent Bakken and statewide figures on flaring rates represent historical lows not seen since before 2008.” (emphasis added)
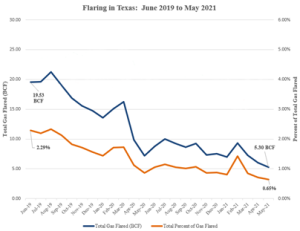
A similar trend is seen in the Permian Basin, another basin examined in the study. The Texas Railroad Commission shows that Texas has one of the lowest flaring rates in the entire country, despite being the largest oil-producing state and one of the largest contributors to the nation’s natural gas production.
From the Texas Railroad Commission:
“…production data shows that the percentage of natural gas flared compared to the natural gas produced from oil and gas wells in Texas dropped from a high of 2.29% in June 2019 to 0.65% in May 2021. During the same period, the volume of gas flared decreased by approximately 73%. The average percentage of natural gas flared has remained below 2% statewide since October 2019, making Texas one of the lowest in flaring rates among all large producing states in the nation.” (emphasis added)
The Railroad Commission and industry leaders have taken repeated actions to reduce flaring in the state, including a new online database of flaring launched this year to increase transparency and best practices, once again demonstrating the industry’s commitment to targeting flare intensity.
Finally, the researchers in the study explain that they cannot make a global assumption based on their observations. However, flaring data from the World Bank finds that despite the United States being the largest producer of both oil and natural gas globally, it has a significantly lower flaring intensity than other major oil and gas producing countries like Russia, Venezuela and Iran.
From the World Bank:
“The United States performed particularly well in 2020, with gas flaring falling by 32 percent from 2019 to 2020 partly due to an 8 percent drop in oil production, but also through the construction of infrastructure to use gas that would otherwise be flared. The United States’ reduction accounted for 70 percent or 5.5 billion cubic meters (bcm) of the global decline.” (emphasis added)
This once again underscores the U.S. oil and natural gas industry’s commitment to targeting flare intensity.
Bottom Line: The U.S. oil and natural gas industry has made significant strides in reducing both routine flaring and flaring intensity, and in lowering overall methane emissions. In fact, despite its outsized role in oil and natural gas production, the United States is leading the charge globally in both of these areas. This study, which contains methodology limitations , runs counter to repeated existing data that show flaring mitigation investments and technology are a key industry focus – one that is showing repeated success year-after-year.