The latest annual edition of “Trends in Global CO2 Emissions” by PBL Netherlands Environmental Assessment Agency and the European Commission’s Joint Research Centre (JRC) contains good news for the world as a whole, and for the United States in particular. The report is the third this year to find that overall world carbon dioxide (CO2) emissions have remained flat for the third year in a row, and that U.S. CO2 emissions continue to decline as well.
Notably, the report credits “the recent slowdown in growth of CO2” to “fuel switches to gas for power generation and increased renewable power generation.”
The report, which bases its CO2 emissions estimates off International Energy Agency (IEA) and BP data through 2016, found the global CO2 levels essentially remained flat in 2015 and 2016. As BP noted earlier this year, the global trend is “well below the 10-year average growth of 1.6% and a third consecutive year of below average growth” and that “during 2014-16, average emissions growth has been the lowest over any three-year period since 1981-83.”
Out of the five highest greenhouse gas emitting countries and the European Union (EU), only India experienced a significant increase in CO2 emissions (4.7 percent) while the EU’s numbers remained relatively flat. China (-0.3 percent), the United States (-2 percent), Russia (-2 percent), and Japan (-1.3 percent) all saw significant CO2 emission decreases in 2016. This reduction from the world’s largest emitters is particularly important because, as the report explains,
“The five largest emitting countries plus the European Union, which together account for 51% of the world population, accounted for 68% of total global CO2 emissions and about 65% of total global GHG emissions.”
U.S. decreases were by far the largest in actual tonnes, as explained by BP,
“Among countries with declining emissions, the US recorded the largest decrement to CO2 emissions for a second consecutive year (and the 6th of the past nine years), falling by 94.7 million tonnes or 2% (compared with the 10-year average decline of 1.1%).” (emphasis added)
To put that into perspective, China saw a drop of 41.4 million tonnes, Russia’s reduction was 31.8 million tonnes, and Japan’s was 15.4 million tonnes. In fact, even the United Kingdom, which reduced emissions by a whopping 6.4 percent, was only 27 million tonnes.
The report’s acknowledgement that increased natural gas use is a big factor in overall CO2 reductions is also in line with IEA’s analysis of 2016 emissions, as that agency noted that the U.S. emission decline occurred while the U.S. economy grew by 1.6 percent, and,
“The decline was driven by a surge in shale gas supplies and more attractive renewable power that displaced coal. Emissions in the United States last year were at their lowest level since 1992, a period during which the economy grew by 80%.” (emphasis added)
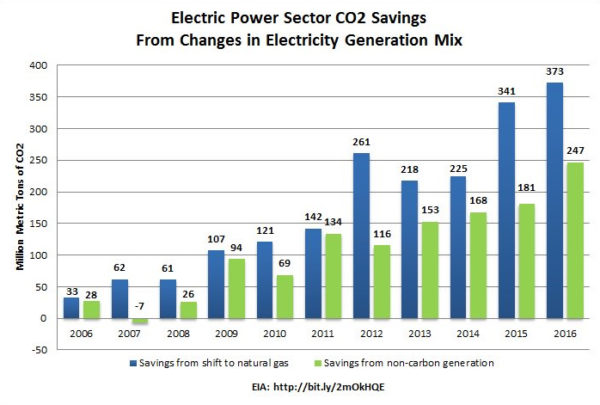
As EID has noted several times before, the trend of carbon reductions along with significant economic growth is unprecedented — and it directly correlates with increased natural gas consumption made possible by the shale revolution, as the following graphic illustrates.

It’s no secret that the emergence of U.S. shale has created an abundant and affordable supply of natural gas across the country, which has led to the increased use of this resource. As the Energy Information Administration (EIA) explained in a report earlier this year, the current shift to natural gas-fired electrical generation has accounted for 63 percent of the 12 percent total reduction in U.S. energy-related CO2 emissions during the last decade.
This latest report further adds to a growing body of research that shows the shale renaissance is helping the United States to be a world leader in emissions reductions, improving the health and environment of our communities without sacrificing the jobs and economic benefits oil and gas development brings.